Map:
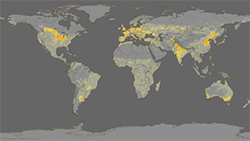
Crop Intensity Maps
The images on this site show crop intensity data (regions that produce the most crops), followed by the cropland products of 26 countries that produce 82% of the world's food. The final image shows the the population density in 2002 and the projected population in 2050.
Lessons Associated with this Resource
Author
NASA Scientific Visualization Studio