Lesson Plan
Where Does It Come From?
Grade Level
Purpose
Students explore the connection between geography, climate, and the type of agriculture in an area by reading background information and census data about the agricultural commodities beef, potatoes, apples, wheat, corn, and milk. Grades 3-5
Estimated Time
Materials Needed
Activity 1: Where Does it Come From?
- 5 small bags of corn chips (to represent corn)
- 5 small bags of potato chips (potatoes)
- 5 small bags of apple chips or individual containers of applesauce (apples)
- 5 small packages of beef jerky (beef)
- 5 small packages of pretzels (wheat)
- 5 small packages of string cheese (milk)
- If you cannot obtain the actual food items listed above, use Snack Images
- Large paper bag
- Where Does it Come From? activity sheet, 1 per student
- Where Does it Come From? Answer Key
- Background Information and Data handouts (beef, potatoes, apples, wheat, corn, milk), 1 topic per group
- United States Map, 1 per group
- Classroom map of the United States
- Colored map pins, 1 color per group
Activity 2: The Food Geography of Your State
- State Agricultural Facts webpage
Vocabulary
bushel: a unit of measurement used in US agriculture that is equivalent to a volume of 64 pints, but is generally standardized by weight for different products; a bushel of wheat weighs 60 lbs, a bushel of corn weighs 56 lbs
bushel: a unit of measurement used in US agriculture that is equivalent to a volume of 64 pints, but is generally standardized by weight for different products; a bushel of wheat weighs 60 lbs, a bushel of corn weighs 56 lbs
by-product: an incidental or secondary product made in the manufacture or synthesis of something else
commodity: a primary agricultural product that can be bought and sold
data: information in numerical form
end product: the final product after processing that is sold to the consumer
hundredweight (cwt): a unit of weight equal to 100 pounds
Did You Know?
- Farm and ranch families comprise just 2 percent of the US population.1
- Today’s farmers produce 262 percent more food with 2 percent fewer inputs (labor, seeds, feed, fertilizer, etc.), compared with 1950.1
- One in three US farm acres is planted for export.1
- In 2014 US farmers produced more than 11 billion pounds of apples, 14 billion bushels of corn, and 200 trillion pounds of milk.2
Background Agricultural Connections
The variety of climates and soils found across the United States makes different parts of our country better suited for raising different agricultural commodities. Many of the fresh fruits and vegetables that we eat are grown in temperate regions like California, Florida, and parts of Texas. These areas have longer growing seasons than other parts of the country. Wheat, barley, corn, and other grain crops grow well in our country’s midsection, which was once grassland. In some parts of the country, the land is not suitable for growing crops but provides good grazing for cattle and other livestock. Potatoes grow best in cooler climates, so they are a good crop for mountainous regions where it stays cool longer in the spring. Some crops require a great deal of rain, and some need plenty of sunshine. Because our country has so many different climates and soil types, we are able to produce many different kinds of agricultural products.
Modern technology makes it possible to process, store, and transport agricultural products on a large scale, allowing us to have just about any kind of food we want to eat at any time of year. Modern technology has also made agriculture more efficient and more specialized. Farmers generally specialize in a limited number of crops or types of livestock that are well suited to the climate and conditions of their respective regions. Agricultural commodities, raw products like wheat and milk, are produced on a large scale and measured by the bushel (grains) or the hundredweight (milk). Commodities are sold and traded and then processed before taking the form of the end product that will reach the consumer. By-products from processing are also used in the highly efficient American agricultural industry.
The USDA Census of Agriculture gathers data tracking agricultural production around the country. This information helps the government ensure a stable food supply and helps farmers assess supply and demand for the different crops they are able to grow given the constraints of climate, soil type, space, and equipment. When viewed as maps of production, statistics from the Census of Agriculture reflect what grows best in which part of the country.
Engage
- Ask students to name their favorite foods. Write the foods on the board.
- Next, ask students if they know what ingredients are used in these foods. Write the main ingredients next to the foods they are found in. For example, if they list pizza as a favorite food, the ingredients would include flour, pizza sauce, cheese, pepperoni, etc.
- Ask students,
- What plants/animals do these ingredients come from? (wheat, tomatoes, dairy cattle, pigs)
- Where are they produced? (on farms)
- Are any of them grown in your state? (answers will vary by state)
- Explain that these ingredients are agricultural commodities. Inform students that they will be learning how geography and the production of their food is related.
Explore and Explain
Activity 1: Where Does it Come From?
- Share the information contained in the Background, and explore the meanings of the words commodity, product, end product, and by-product. To illustrate, bring to class some examples of end products and the agricultural commodities from which they were made (e.g., cotton ball—or raw cotton boll, if available—and cotton shirt, dry beans and bean dip, tomato and tomato sauce, apple and apple cider). Ask students to differentiate between the commodity and the end product.
- Place all the snacks (or images) in a large paper bag, and have students draw from the bag to determine which group they will work with. Explain that each snack represents a major agricultural commodity grown in the United States. Write the words corn, potatoes, apples, beef, wheat, and milk on the chalkboard. Lead a class discussion to help students determine which product each snack represents.
- Give each student a copy of the Where Does it Come From? activity sheet, and ask them to answer the first three questions.
- Give each group a copy of the Background Information and Data handout about the specific agricultural commodity the group will be studying and a copy of the attached map of the United States.
- Instruct students to read the background information and examine the data to answer the remaining questions on the activity sheet. Then they should locate the top five states where their snacks grow on their United States maps and color those states.
- Provide each group with a different color of map pins. Have each group report on its findings and mark on a classroom map the states where the designated food grows. Students should also report on the growing conditions necessary for each product.
- Lead a discussion in which you ask students what factors determine what is grown in which states (climate, availability of land, transportation, storage capacities) and how much is produced (climate, size of state, soil type).
Activity 2: The Food Geography of Your State
Link to your state's Agriculture in the Classroom Program to access "state specific" lessons and resources.
- Record students' favorite fruits and vegetables on the board. Ask the students to identify which of the fruits and vegetables on the list are grown in your state by placing a star next to them?
- Visit the State Agricultural Facts webpage. Click on your state to find more information about your state's agricultural resources.
- Discuss the types of crops that are grown in your state and why. List some of the climatic conditions that encourage or limit the types of crops that can be grown (availability of water, summer heat/winter cold, length of growing season, etc.).
 |
This lesson explores foundational concepts about how climate and geography impact the production of our food and the location of farms throughout the United States and abroad. If you teach in the following states, refer to your local agricultural literacy geography resources:
|
Elaborate
-
Play the My American Farm interactive games Where in the World? and Ag Across America.
-
Have students keep records for a week of what foods are served in the cafeteria. Have them research to find out what commodity ingredients are used in the foods. Use the data provided with this lesson to determine where the ingredients were most likely grown.
-
Have students interview those responsible for buying the food used in the cafeteria and determine how much, if any, local food is used in preparing meals.
-
Have each student choose a favorite food and research the three main ingredients in the food and where the ingredients are produced.
-
Have students stay in their groups and research the states in which their commodity is grown to find climate, population, other crops grown, etc. Then have each group choose a presentation method to report their findings to the class—skits, posters, etc.
-
If you have internet access for your students, have the groups explore the maps available for their commodity on the USDA Ag Census Web Maps. Encourage them to explore the different categories. Potatoes are classified as a field crop rather than a vegetable.
-
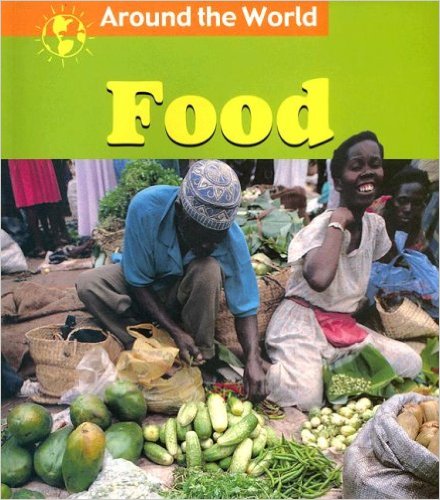 Use the Around the World book Food by Margaret Hall to further explore the connections between geography and agriculture. This book clearly illustrates how peoples' diets, clothes, homes, and modes of transportation are influenced by where they live.
 -
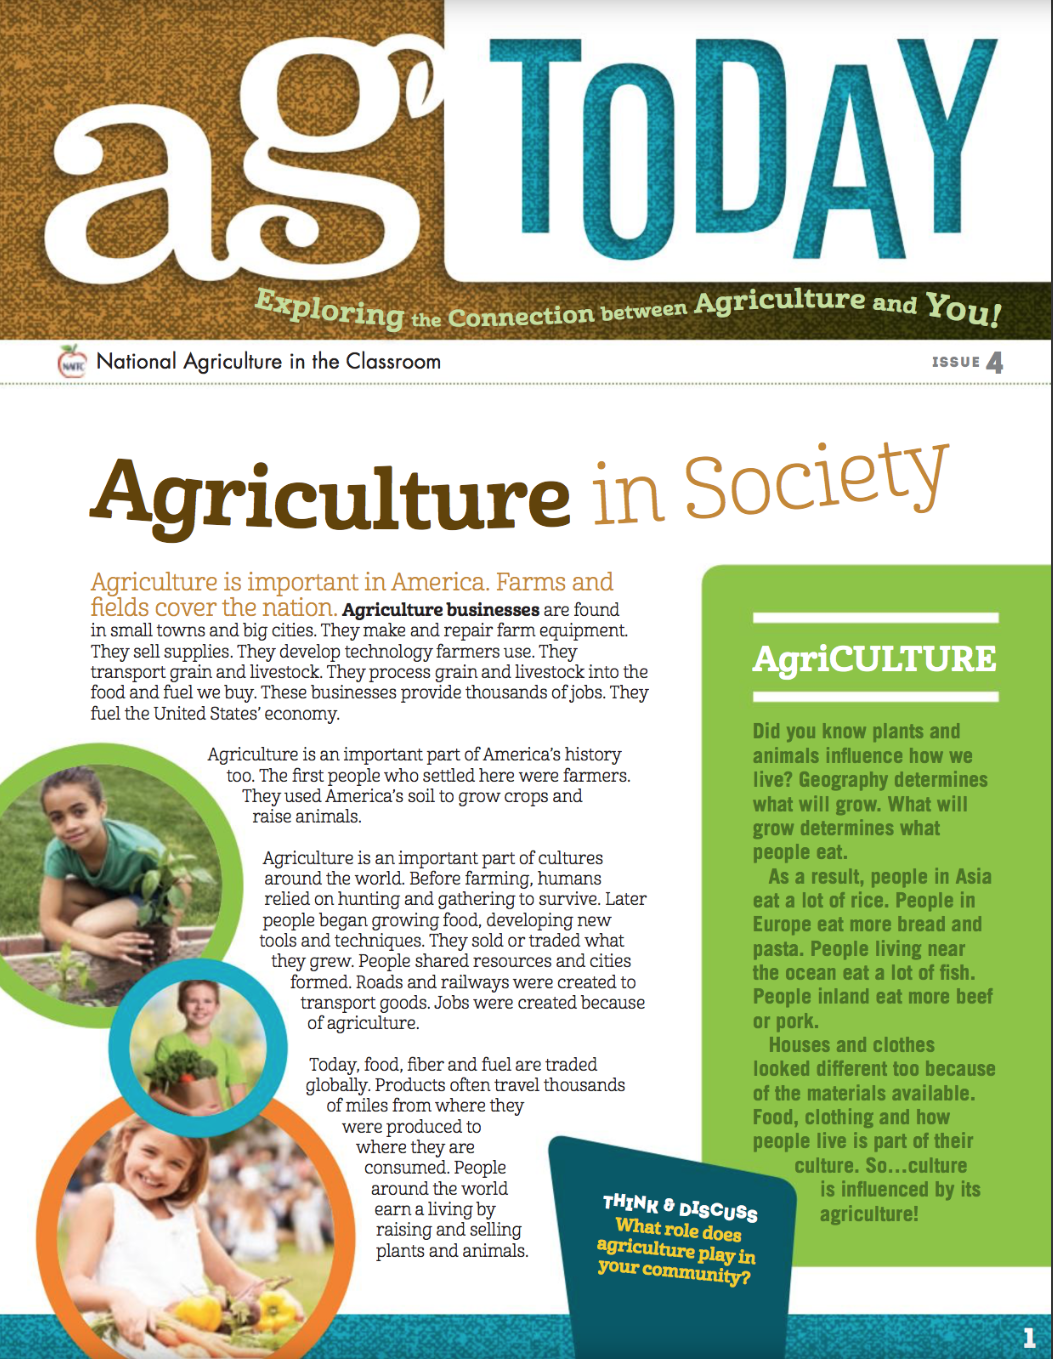 Read Issue 4 of Ag Today titled Agriculture in Society. This reader can be printed or accessed digitally. Students will learn how agriculture plays a significant role in different geographic areas such as small towns, large cities, and local, state, and federal government. It also places a focus on where food comes from and why different foods are grown in different states.
Evaluate
After conducting these activities, review and summarize the following key concepts:
- Many agricultural commodities require a specific climate and environment for growth. Therefore, they are grown in suitable geographic areas.
- Some commodities are grown in abundance in the United States and exported to other countries. Other commodities are imported.
- In addition to climate, natural resources such as water and soil affect whether or not a commodity can be produced in a specific area.
Recommended Companion Resources
- 40 Maps that Explain Food in America
- Ag Census Web Maps
- Ag Today
- America's Heartland: Maine-ly Apples
- America's Heartland: Wheat Episodes
- Apples
- Before the Plate Website
- Building with Apples
- Eat Happy Project video series
- First Apple
- From Apple Trees to Cider, Please!
- George Crum and the Saratoga Chip
- Grow! Raise! Catch!
- How to Feed the World in 2050: Actions in a Changing Climate video
- How to Grow an Apple Pie
- If the World Were a Village
- Interactive Map Project
- Learn More: Farmers Market
- Livestock Flowchart
- Mr. Crum's Potato Predicament
- My American Farm
- My Family's Corn Farm
- My Family's Farm Book Series
- Planet Food Online Game
- Potatoes for Pirate Pearl
- The Food Timeline
- The Life of a Potato
- The Scrambled States of America
- The Story of Food: An Illustrated History of Everything We Eat
- The Very Hungry Western Caterpillar
- Two Old Potatoes and Me
- Where Does Your Pizza Come From?
Author
Organization
 |
We welcome your feedback! If you have a question about this lesson or would like to report a broken link, please send us an email. If you have used this lesson and are willing to share your experience, we will provide you with a coupon code for 10% off your next purchase at AgClassroomStore. |